

Solutions for transport planners and planning consultancies
Transport planners and planning consultancies do not need measuring instruments, but rather reliable figures to answer a specific question – with the level of accuracy required to underpin a planning decision. DataCollect offers two technically distinct data collectionmethods: radar-based cross-section measurement using the SDR side-view radar and AI video detection using ARGOS. This page shows which method is suitable for which specific question, what the limitations of each method are, what analyses result from them, and how the data can be integrated into your own system environment.
The research question determines the measurement method
Both methods count traffic, but they answer different questions. The SDR side-view radar performs contactless cross-sectional measurements and provides volume, speed, object length and timestamps with lane-level accuracy. The ARGOS AI video detection analyses entire traffic areas and additionally provides information on the type of road user and the travel relationship. The difference lies not in accuracy, but in measurement geometry.
| Your query | Suitable method | Why |
|---|---|---|
| How many vehicles, at what speed, in which length class – on an unobstructed section of road? | SDR side-mounted radar | Cross-sectional measurement with lane-accurate individual vehicle detection; 4 or 6+ freely configurable length classes |
| How are turning flows distributed at a junction? | ARGOS AI video detection | Detects entire traffic areas including turning patterns; side radar cannot technically be used at junctions |
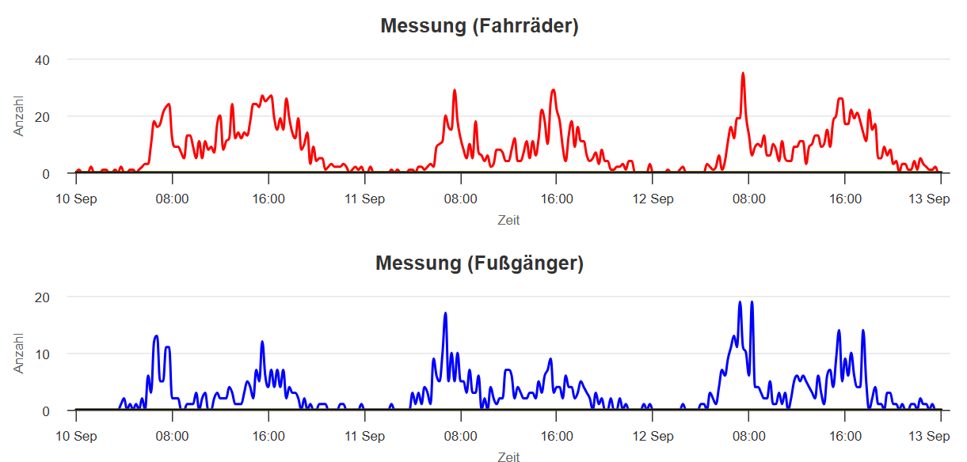
| How much cycle and pedestrian traffic, broken down by type? | ARGOS AI video detection | Currently 11 object classes including pedestrians and cyclists, with an expansion to 14 announced; the side-view radar distinguishes by object length, not by type |
| What does the origin-destination traffic at a junction look like? | ARGOS AI video detection | Source and destination traffic analysis via travel relationships; can be refined retrospectively via recounting |
| How does a permanent monitoring point perform over the course of a year? | Both methods | Side radar with a 230 V connection or a solar system for 365-day continuous operation; ARGOS permanent for continuous junction monitoring |
| Is there a particular hazard due to excessive speed? | SDR side-mounted radar | Speed statistics plus police reports; frequently used as a pre-selection tool by police authorities |
| How does a measure affect driving speed? | DSD speed display | Effectiveness monitoring via entry and exit speeds; records volume and speed, but NO object classification |
Junctions and complex traffic situations
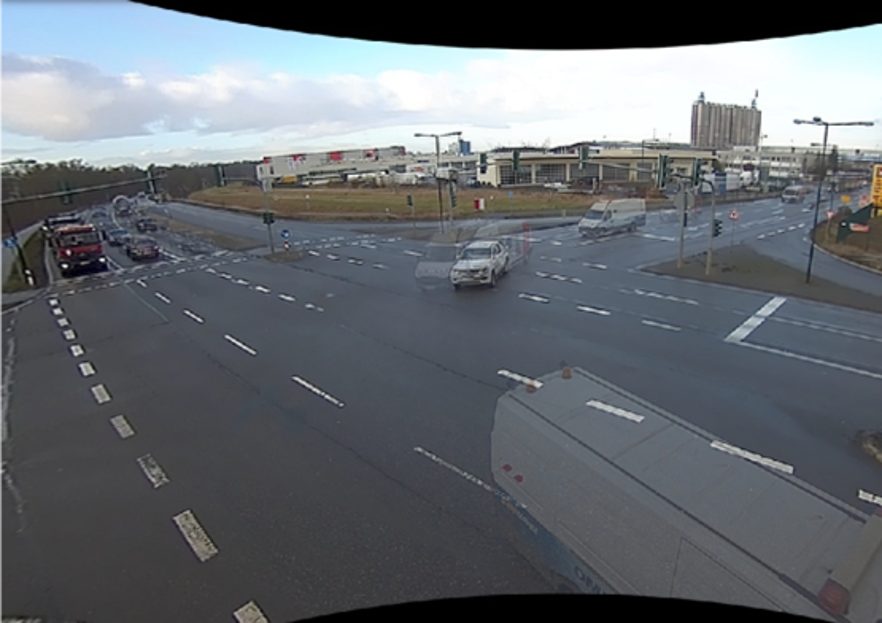
The ARGOS AI video detection system processes data directly within the device (edge AI, on-board). This means the data is available immediately and there is no need to transfer video footage for analysis. It captures junctions, multi-lane arterial roads, roundabouts and areas with cycle and pedestrian traffic – in other words, precisely those situations where a cross-sectional measurement is insufficient.
- Turning patterns at junctions and in roundabouts
- Source and destination traffic analysis based on the recorded travel patterns
- Currently 11 object classes, including pedestrians and cyclists – the type of road user, not just their length. An expansion to 14 object classes has been announced; new additions include scooters, bicycles with trailers and cargo bikes
- Bicycle counting in mixed traffic and separate pedestrian detection
- Bidirectional and multi-lane detection on main roads
- Over 95 per cent accuracy in the Mobility Lab test, even with an average daily traffic volume of 70,000 to 100,000 vehicles
- Detection range: an intersection with a diagonal of around 50 m is covered by a single camera, whilst a junction with a diagonal of around 65 m is covered by two cameras
The captured data is transmitted immediately via LTE or downloaded by the system via Wi-Fi once the measurement is complete. You can store it in the associated myTrafficData cloud solution or feed it directly into your own traffic data management system.
One measurement, multiple questions: recounting
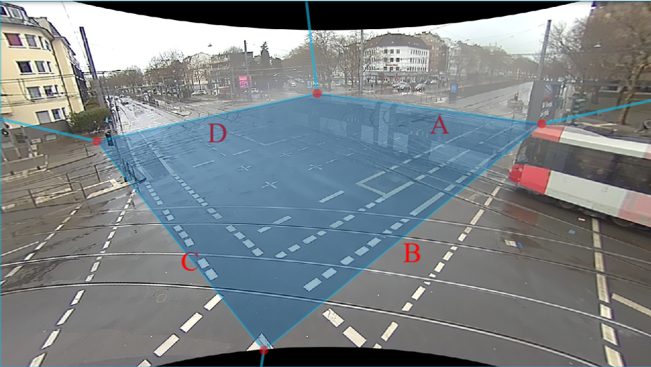
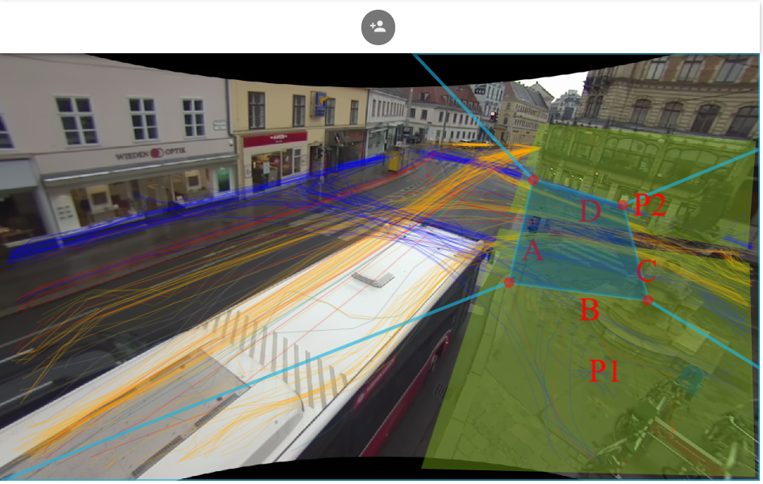
During configuration, you mark the areas to be captured using a polygon tool. This tool remains available after the measurement: you can move the capture areas up to 90 days laterand have the existing data recalculated. This is unique – and for design consultancies, it means that a change in requirements does not necessitate a new measurement campaign.
1. Measurement
The measurement areas are defined as polygons during configuration. The analysis is carried out within the device.
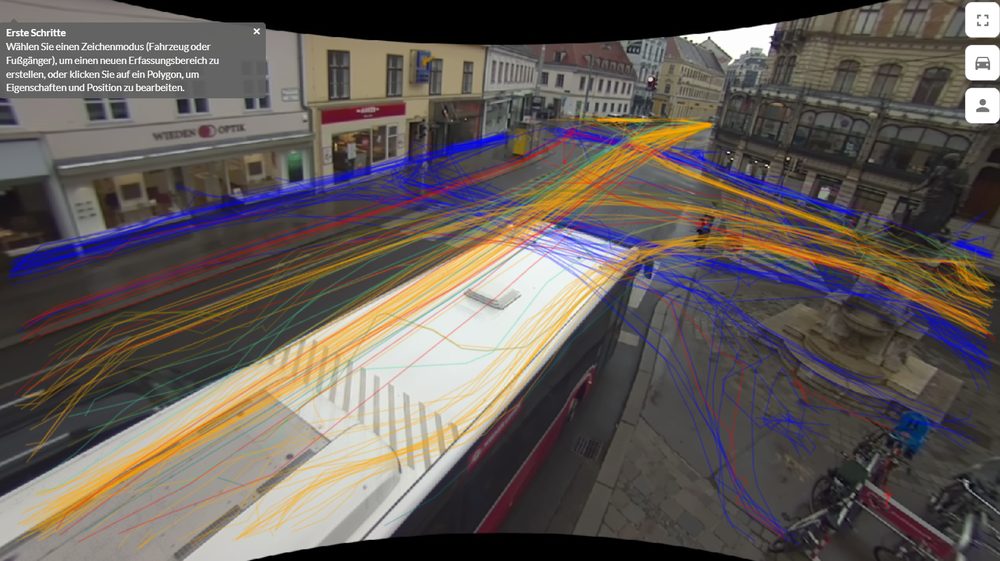
2. See where traffic actually flows
The heatmap reveals the routes road users actually take – including those that nobody involved in the project had anticipated.
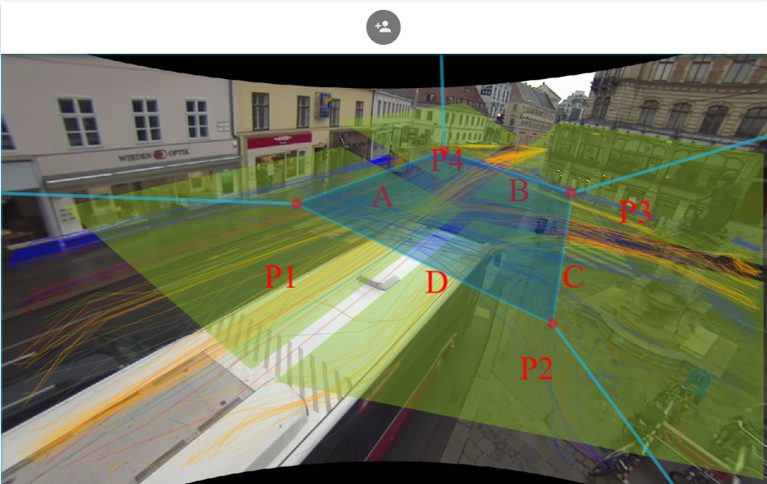
3. Adjusting measurement areas
Up to 90 days after the measurement, the areas can be moved and optimally positioned without having to return to the site.
4. Recalculate
The complete raw data is re-analysed against the new zones – further insights are derived from the same measurement.
Two typical examples from planning practice: the source-destination traffic at a junction can subsequently be analysed in greater detail, and cyclists crossing via the footpath can be analysed, even though this was not the focus when the measurement was set up.
Cross-sections: what the side-mounted radar can do
The SDR side-mounted radar measures traffic contactlessly from the kerb. It is available in two versions: SDR traffic measures in both directions, SDR Dual lane measures in both directions and in one direction. It can detect up to three lanes, in two possible configurations: two lanes in one direction plus one in the opposite direction, or a cycle lane plus two lanes travelling in opposite directions. Individual vehicle detection is lane-specific. Classification is based on 4 or 6+ freely configurable length classes; the system outputs the date and time, object length and speed.
- Self-calibrating – on-site configuration via smartphone, with measurement quality immediately verifiable
- Both variants can be used in mobile or continuous operation, not just for short-term measurements
- In battery mode, measurement campaigns lasting several weeks
- For the upcoming AI video detection system ARGOS 2.0, DataCollect specifies a battery life of around 7 days with the large battery pack and around 36 hours with the small one
- With a 230 Vconnection or a solar system, 365-day continuous operation is possible at permanent measuring points
- Millions of data records can be stored; installation height is variable
- Optional 4G/LTE data communication for remote control and data transmission
- On-site configuration and data retrieval via the SDR app for Android
- Accuracy verified by extensive testing carried out by the Carinthian provincial government and the Grand Duchy of Luxembourg, which use the SDR Dual Lane as permanent measuring points – over 98 per cent for traffic counting, depending on location and average daily traffic volume
Limitations of the method
The side-mounted radar is purely a cross-sectional measurement and cannot technically be used at junctions or roundabouts. Anyone requiring turn-off data needs AI video detection. We state this limitation openly because misplacing the system in a project is more costly than providing honest information.
From measurement to planning basis
Configuration, evaluation and administration are carried out via one of the available myTrafficData cloud solutions – web-based, developed and hosted in Germany. Reports can be generated whilst a measurement is in progress or immediately upon its completion, as presentable PDF reports containing graphical and tabular data.
| Analysis | How this informs your planning |
|---|---|
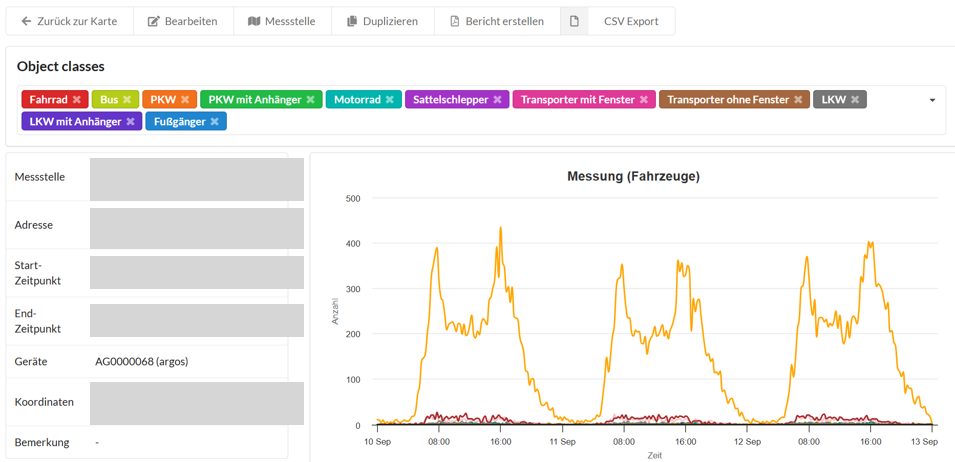
| Traffic volume trend lines (side radar) | Daily and weekly trends as a basis for capacity assessment and peak-hour analysis |
| Vehicle classes (side-mounted radar) | Distribution by length class, including the proportion of heavy goods vehicles |
| Police report (side-mounted radar and speed display from the ‘smart’ level upwards) | Speed indicators with a focus on potential hazards – as a pre-selection tool for authorities |
| Object classes (AI video detection) | Traffic volumes by type of road user, currently including pedestrians and bicycles; with the announced expansion, this will additionally include bicycles with trailers, cargo bikes and scooters |
| Peak hour output (AI video detection) | Peak hour relevant for design purposes, derived directly from the measurement |
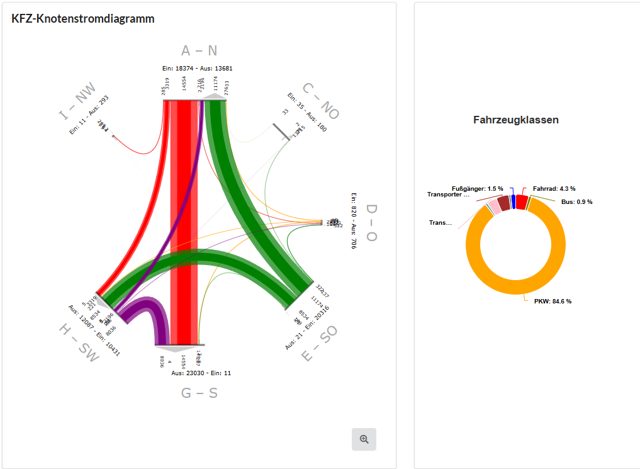
| Junction representation (AI video detection) | As a motor vehicle junction flow diagram: Turning flows per junction arm with vehicle class distribution – the standard form of presentation for junction assessments |
Export and transfer to your own system environment
In addition to the PDF report, the raw data can be exported for further processing. The AI video detection system offers XLS, CSV, VZA Web Report, LISA+ and PTV Visum as standard; with TXT also available for side-view radar. Project- or client-specific interfaces are available. Via FTP transfer or API, data from each system can be fed directly into higher-level traffic data management systems.
Data protection and contract eligibility
The AI video detection system operates in full compliance with the GDPR: analysis takes place within the device, and only anonymised object data is stored. Actual video recording is not necessary for the analysis. The cloud platform is developed and hosted in Germany.
- Analysis carried out within the device – no transmission of image material required for analysis
- Only anonymised object data is stored
- Cloud developed and hosted in Germany
- Radar measurement does not record any personally identifiable characteristics anyway
- Maintenance and repairs carried out in a certified workshop, quality assurance before every release
Technically responsible: Mario Lippoldt, Managing Director of DataCollect Traffic Systems GmbH, Dipl.-Wirt.-Ing. (FH). He is responsible for product development in the fields of traffic data collection and speed display, and is named as the inventor in patent DE 10 2022 129 914. Contact: info@datacollect.com
Frequently Asked Questions
The ARGOS AI video detection system. It captures entire traffic areas, including turning patterns. The SDR side-view radar is a cross-sectional measurement method and cannot technically be used at junctions or roundabouts.
The ARGOS AI video detection system currently distinguishes between 11 object classes, including pedestrians and cyclists; an expansion to 14 object classes has been announced, with scooters, bicycles with trailers and cargo bikes being added. The SDR side-view radar classifies objects into 4 or 6+ freely configurable length classes based on object length, rather than by type of road user.
The detection zones set during configuration can be adjusted up to 90 days after the measurement. The existing data is then recalculated based on the new zones. This means that a single measurement can be used to answer further questions without the need for a new measurement.
With the SDR side-mounted radar, measurement campaigns lasting several weeks are possible when running on battery power. With a 230 V connection or a solar system, continuous operation for 365 days is possible at permanent measuring points.
As a presentable PDF report and as a raw data export. The AI video detection system offers, as standard, XLS, CSV, VZA Web Report, LISA+ and PTV Visum; for the side radar, TXT is also available. Project- or client-specific interfaces are available. The data can be fed into higher-level traffic data management systems via FTP transfer or API.
The ARGOS AI video detection system operates in full compliance with the GDPR: analysis takes place within the device, only anonymised object data is stored, and actual video recording is not required for the analysis. The cloud platform is developed and hosted in Germany.
Yes. DataCollect offers the measurement systems for both purchase and hire.
Do you have a specific question and are unsure which method will provide the answer? Or do you need a particular interface for your system landscape? For enquiries regarding systems and tenders, please contact the sales management: Tim Lierenfeld, lierenfeld@datacollect.com. For technical enquiries regarding measurement technology, please contact Mario Lippoldt, Managing Director: info@datacollect.com, telephone +49 2273 5956-0.