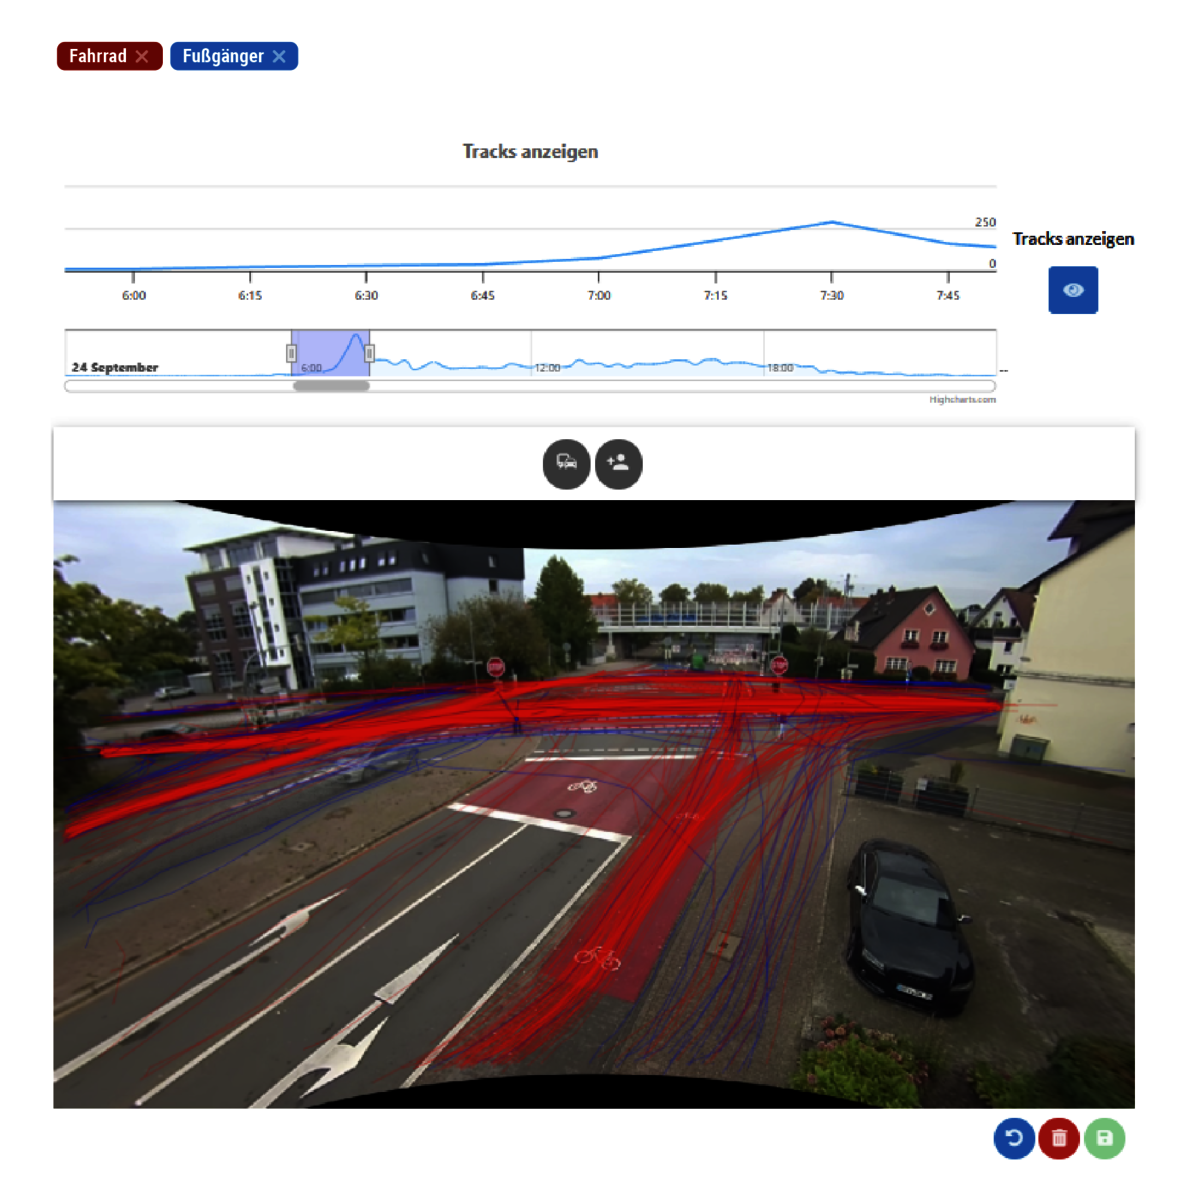
New at ARGOS: Visual analysis via heat map function
The detection and storage of object movements in the camera's field of view creates a new database that can be used not only during configuration, but also subsequently via the MyTrafficData platform. The recorded trajectories are visualised there as interactive heat maps.</p
<p>This visualisation offers far-reaching new analysis options: For example, anomalies in traffic behaviour can be identified and questions such as "Are cyclists using the pavement without permission?" or "Where are potential danger spots located?" can be answered in a well-founded manner.
<p<p>Another highlight: the heat map can be dynamically filtered according to object classes such as cars, bicycles or pedestrians. It is also possible to narrow down the data analysis in terms of time, which supports even more targeted analyses.</p
<p>This function not only makes traffic monitoring more detailed, but also much more meaningful.
Do you have any questions or would you like to book a free live demo? Feel free to contact us by phone 02273 5956-110 or email vertrieb@datacollect.com.
We look forward to hearing from you!
Your DataCollect team